Hydrogen and Ammonia Industry
Frontline Report 2024
This exhaustive Off-the-Shelf Industry Report covers industry structure and outlook,
manufacturing technologies, revenue models, and business strategies in the hydrogen/ammonia market.
Executive summary
- EPI’s standard model projects that the demand for hydrogen/ammonia will reach 330 million tons (hydrogen equivalent) by 2050. At 30 yen/Nm3, the demand of which has a market value of around 100 trillion yen.
- In the most competitive regions, the expected cost of green hydrogen production in 2030 is around 20 US¢/Nm3, which is 50% higher than the 14 US¢/Nm3 heat-equivalent cost of LNG (assuming LNG cost of 10 USD/MMBtu). Therefore, the large-scale adoption of hydrogen is expected to begin in countries where incentives are provided.
- The Hydrogen Allocation Round (HAR1) results of hydrogen manufacturing projects in the United Kingdom were announced in December 2023, and the weighted average strike price was 111 US¢/Nm3. Considering manufacturing costs of ~80 US¢/Nm3 (as analyzed by EPI), profits are expected to be ~30 US¢/Nm3.
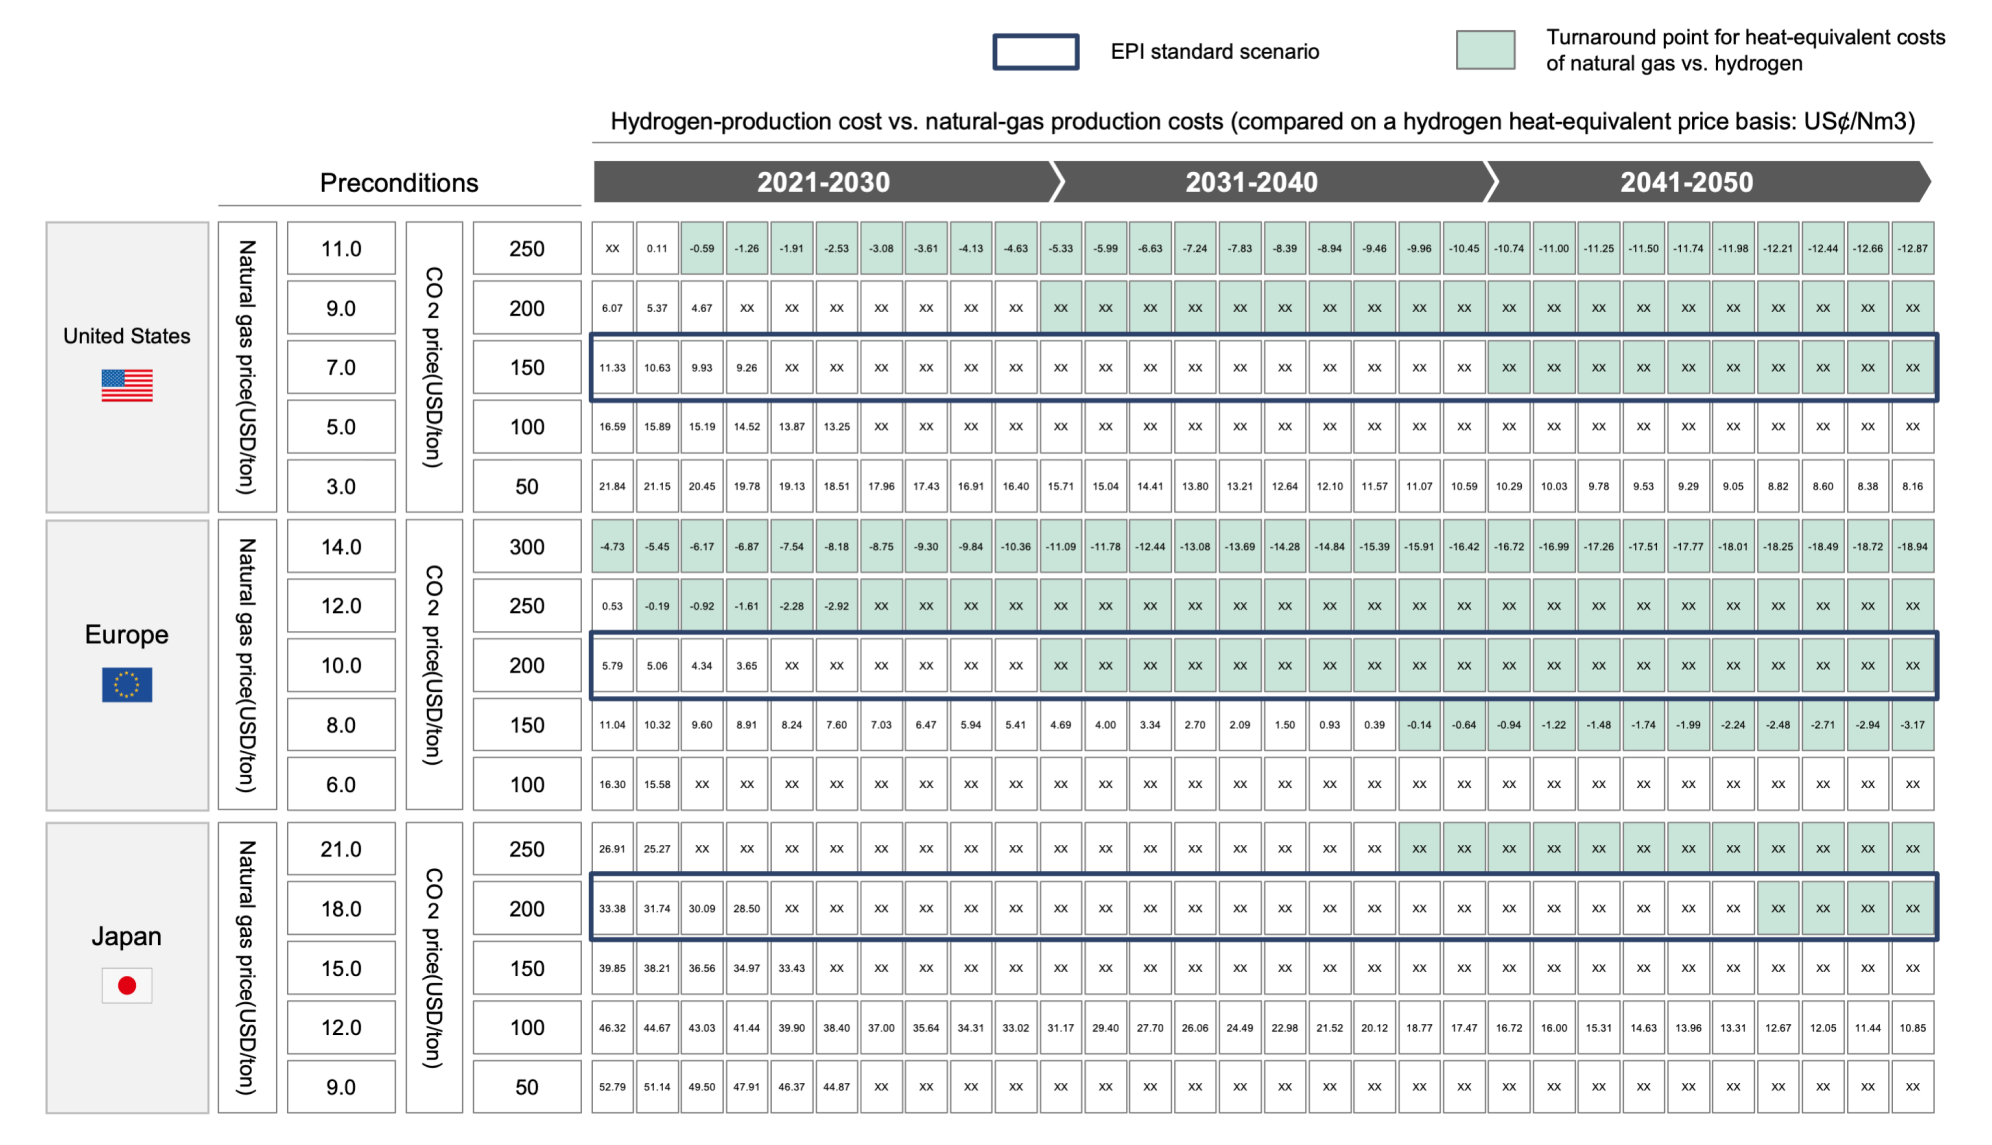
- EPI’s standard model projects that the competitiveness of green hydrogen will still take some time to match that of natural gas. Until expected timepoints—early 2030s in the EU, around 2040 in the United States, and mid 2040s in Japan—regions and markets implementing the right policies must be adroitly selected and operations should be expanded in these regions with the proper utilization of subsidies to reduce costs. This will require fine-tuned strategies.
Outlook on the global hydrogen/ammonia market
While their high expectations as next-generation clean fuels, hydrogen/ammonia have been historically used in fertilizers and industrial processes. As per the EPI standard scenario, the global market size of hydrogen will increase from around 100 million tons in 2020 to 330 million tons (hydrogen equivalent) by 2050, a 3.3-fold increase, as hydrogen becomes more established as a fuel source (Figure 1). Assuming a hydrogen price of 30 yen/Nm3, this increased demand implies a colossal market worth of 111 trillion yen worldwide in 2050. This projected market worth is equivalent in scale to around 35% of the present-day market for crude oil, which was 316 trillion yen as of 2022.
Figure 1 Global demand for hydrogen/ammonia (including international bunkering)
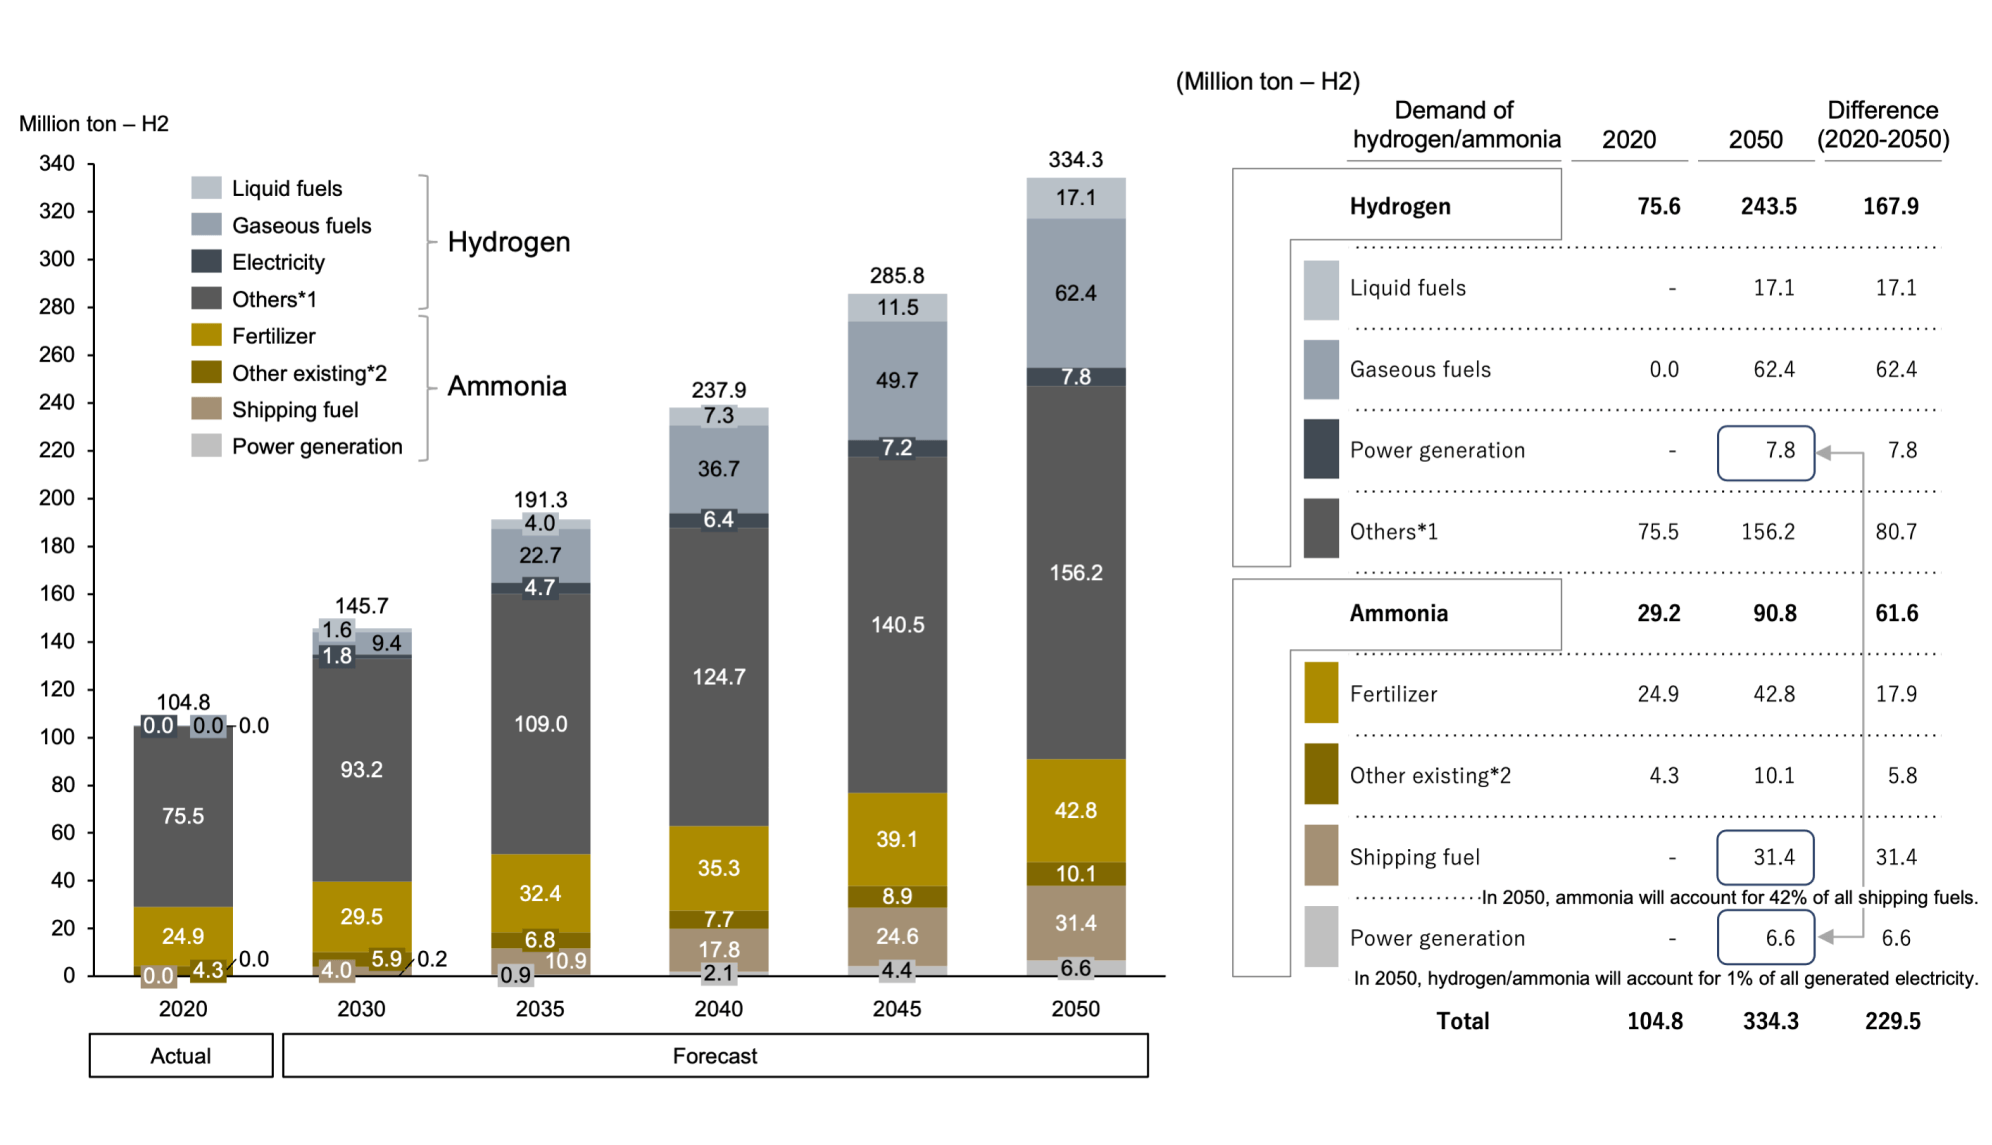
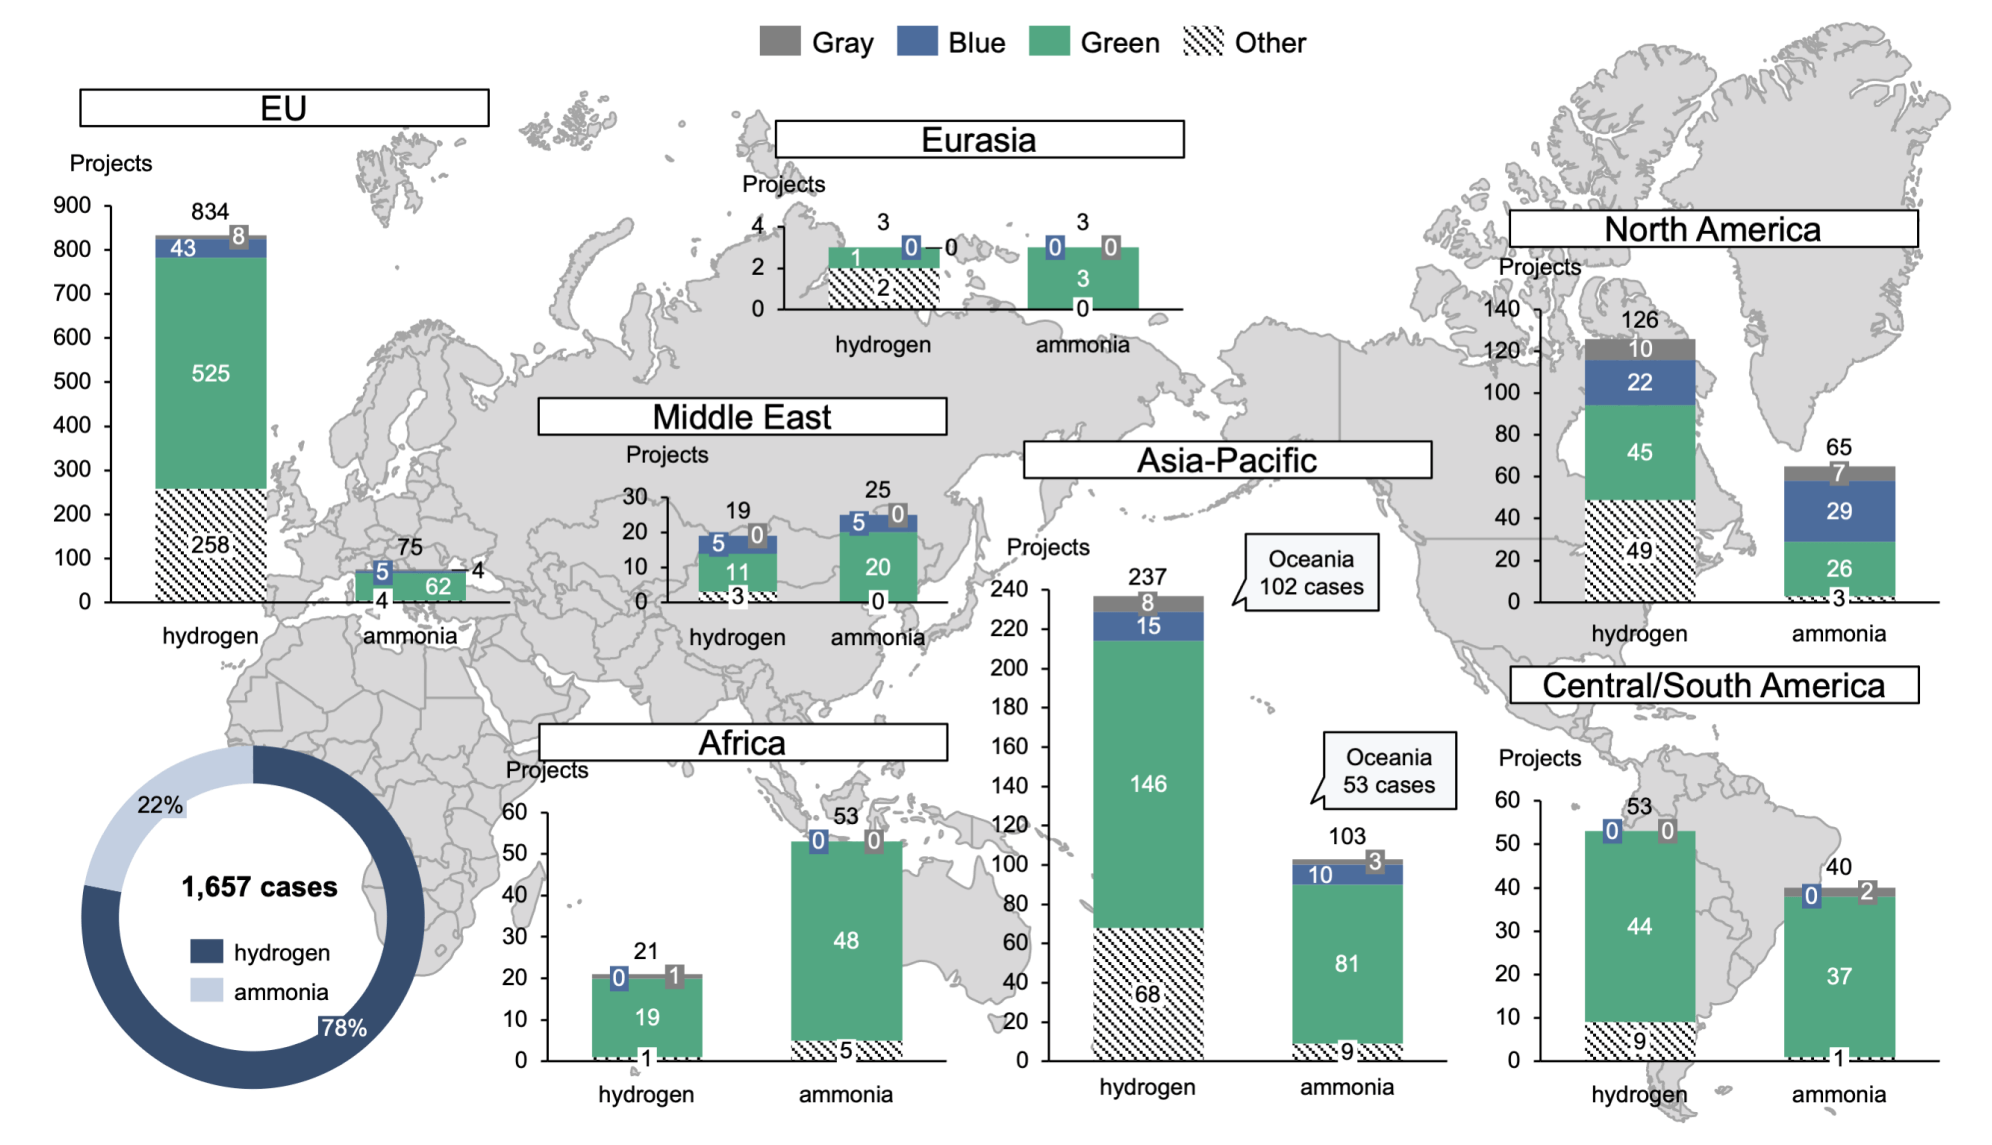
Figure 2 shows planned hydrogen/ammonia production projects in different regions as of 2023. Such projects total 1,658 across the globe, including a high percentage of green hydrogen (renewable energy) production projects. Green hydrogen production projects account for approximately half of the hydrogen production projects in the European Union (EU), where the rate of renewable energy introduction is high and related costs are low. Meanwhile, green ammonia production is widespread in the Asia-Pacific region, with 53 such projects planned in Oceania.
Figure 2 Number of hydrogen/ammonia production projects by region*
Hydrogen supply and transportation costs
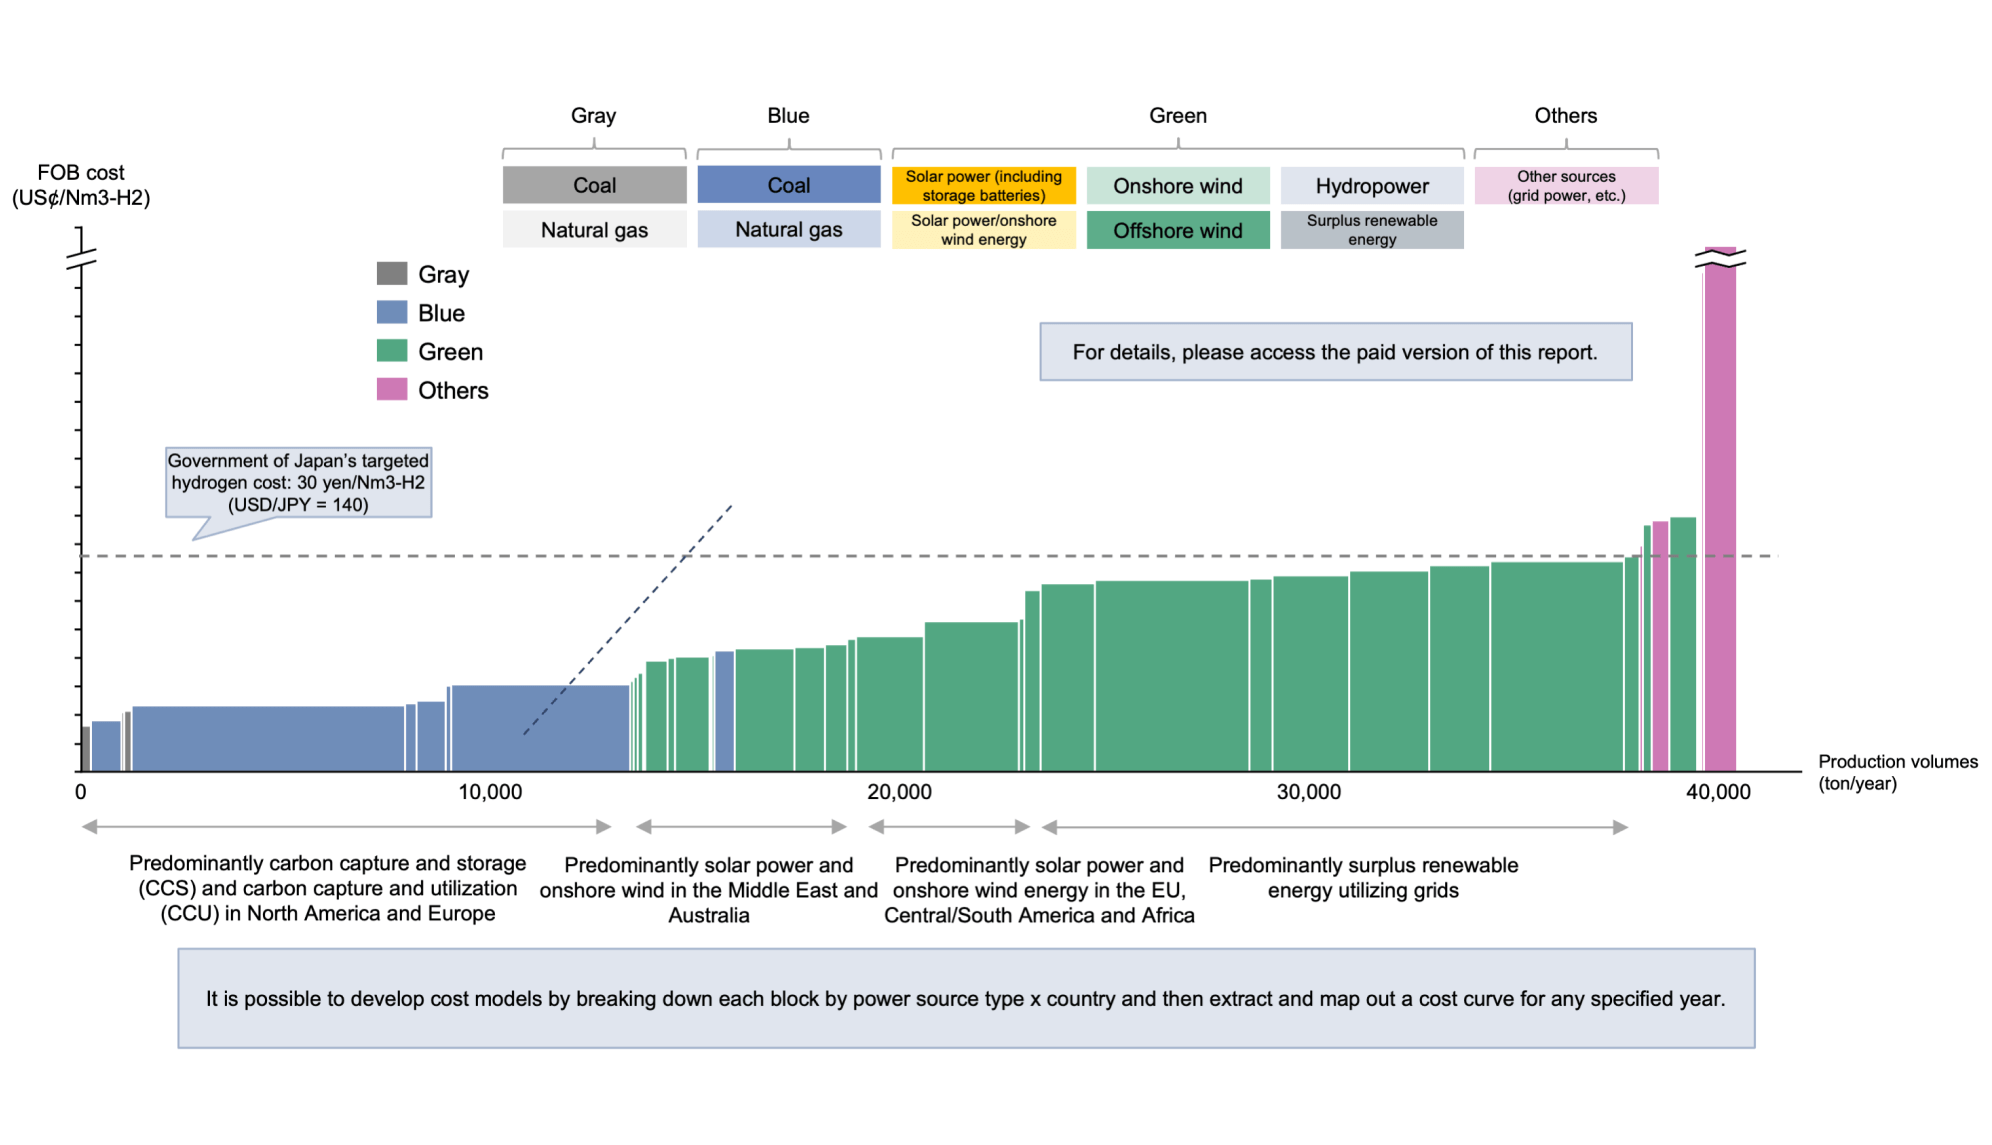
The widespread adoption of hydrogen/ammonia is mainly limited by cost. According to EPI’s hydrogen production cost model (Figure 3), the current cheapest source of CO2-free hydrogen is blue hydrogen sourced from Middle-East-associated petroleum gas and North-American shale gas, which costs 9–12 US¢/Nm3 on a free-on-board (FOB) basis. In comparison, green hydrogen derived from renewable energy is expected to cost 20 US¢/Nm³ in 2030, even in regions such as the Middle East and Australia where solar irradiance conditions are excellent. As green hydrogen is 50% more expensive than LNG (10 USD/MMBtu) on a heat-equivalent basis, its immediate wide scale adoption is unlikely unless subsidies are provided.
Figure 3 Estimated global hydrogen-supply cost in 2030*
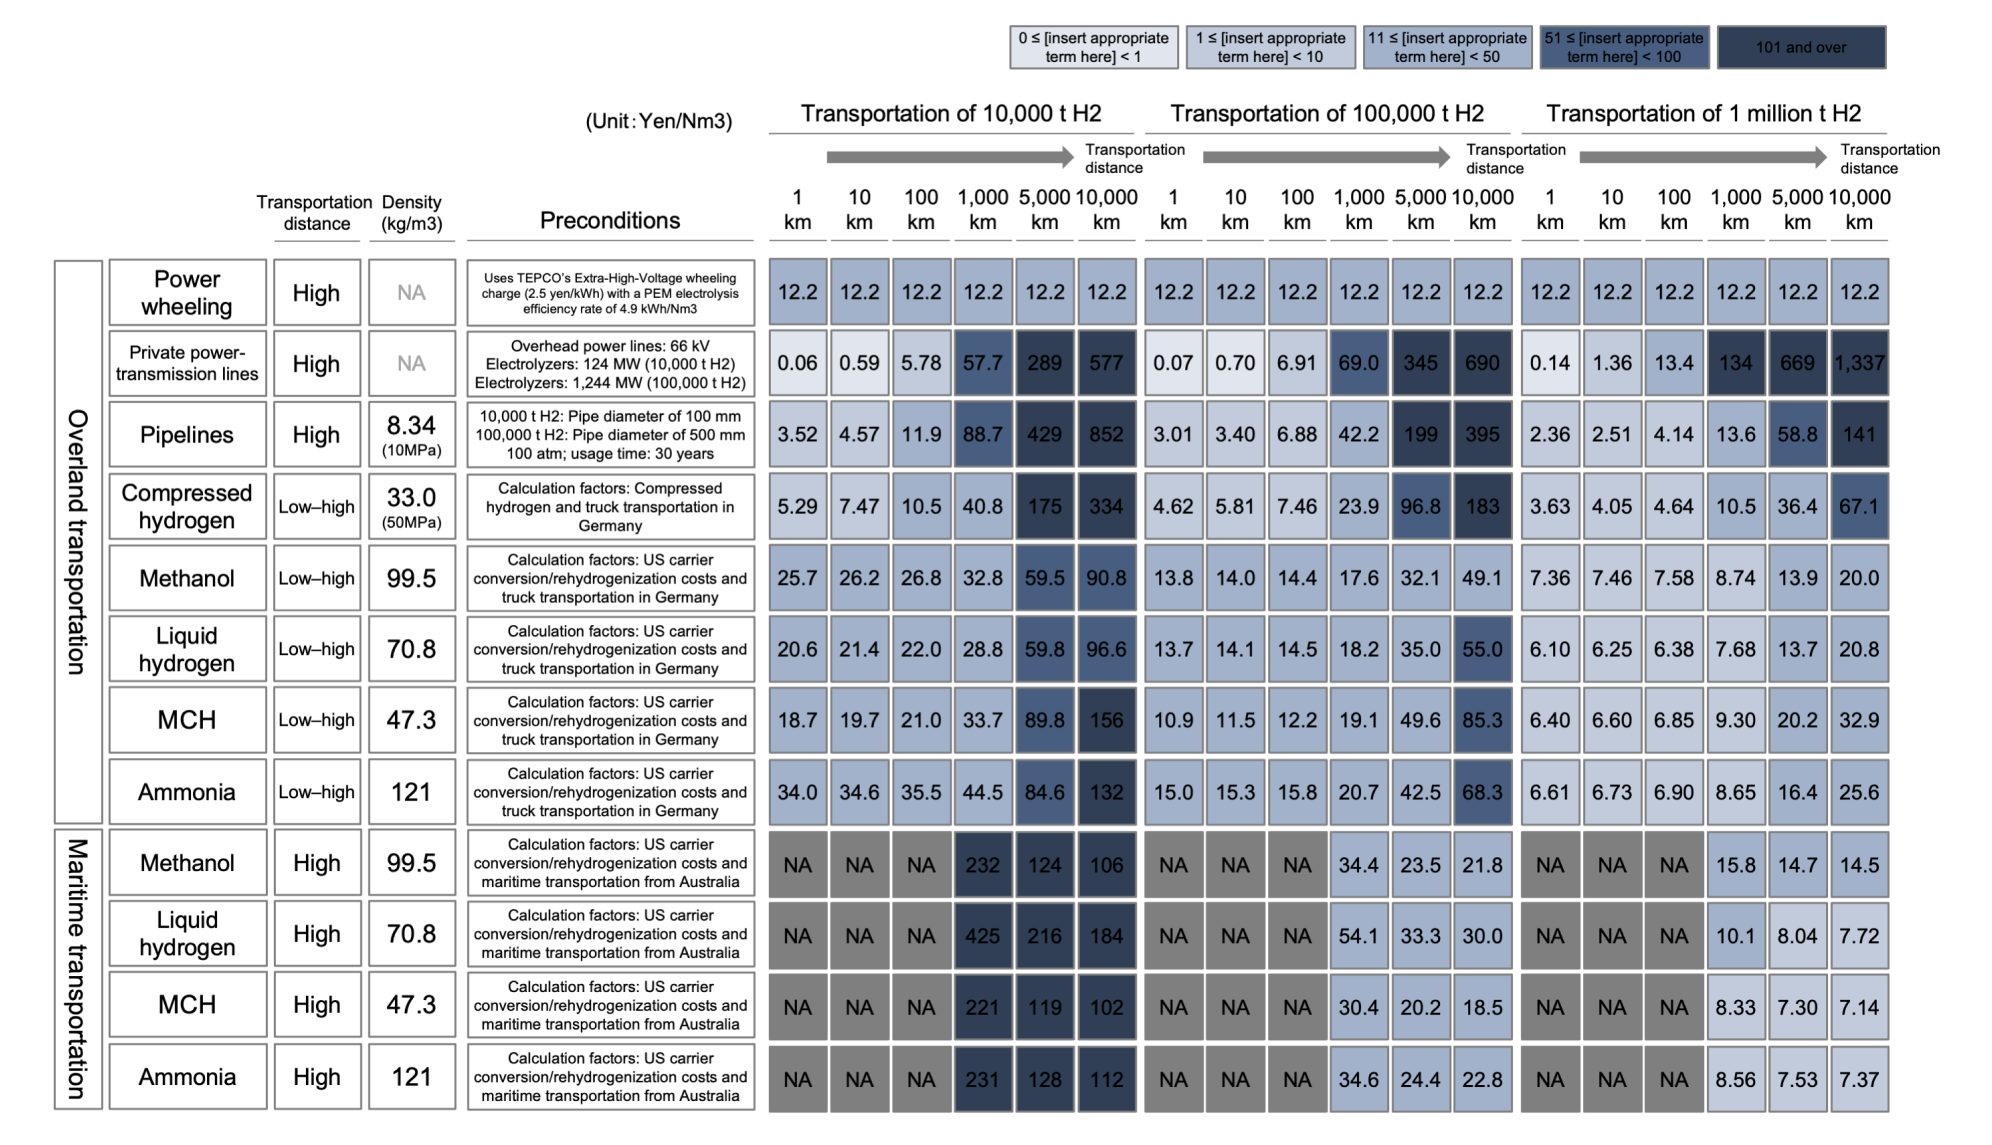
Identifying locations with low production costs and optimizing the costs of transportation to high-demand regions are essential. EPI has developed a cost model of hydrogen/ammonia transportation and Figure 4 shows transportation costs under the standard conditions of the model. Methylcyclohexane (MCH), ammonia, and liquid hydrogen are potential hydrogen carriers for long-distance transportation. MCH and ammonia are the favored carriers under the standard conditions identified in the EPI model, but MCH-to-hydrogen reconversion requires heat energy. Liquid hydrogen, which has a higher energy density per unit mass than MCH and lower regasification costs, may be preferred when hydrogen needs to be divided into small lots and transported after landing. While land transportation is typically carried out using pipelines, compressed gas and methanol transport may be preferred for shorter distances and/or lower transportation volumes. The most cost-effective carrier will depend on the transportation method and other factors. Therefore, the optimal transportation technology for maritime or land transport should be chosen based on distance and transportation volume. Details and preconditions of the transportation cost models are provided in the paid version of this report.
Figure 4 Transportation costs for each mode/scale of distance
Establishing business models
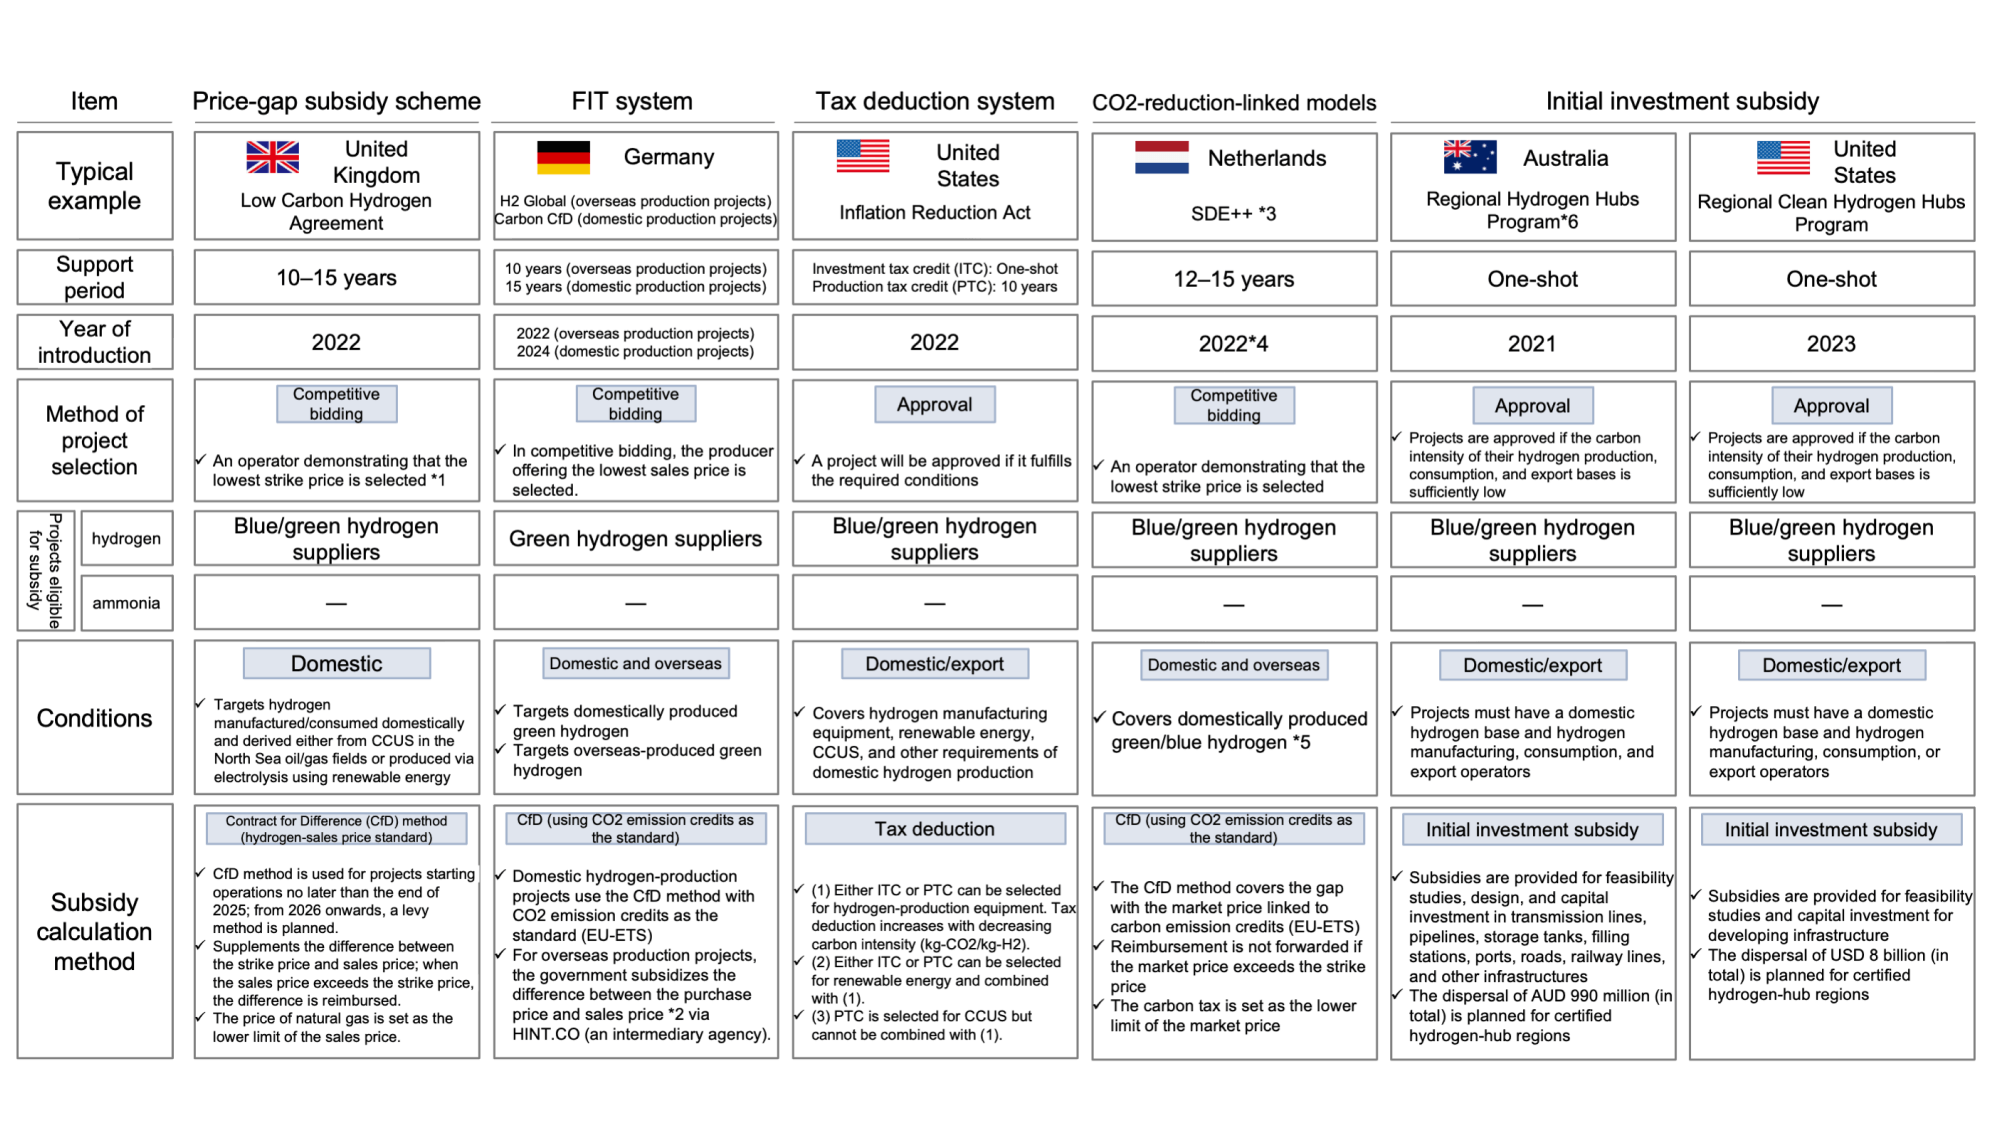
Reducing production and transportation costs is essential for the widespread adoption of hydrogen, but cost-competitive hydrogen is unlikely to be achieved in the short term. Initial demand is growing in countries where hydrogen is incentivized by governments. Demand is being led by Japan, the United States, and Europe. The UK introduced a feed-in tariff (FIT) scheme for blue and green hydrogen in 2022. The United States introduced its Inflation Reduction Act (IRA) in the same year. A price-gap subsidy scheme similar to that implemented in the UK is expected to be implemented in Japan by 2030 (Figure 5). Subsidy schemes for export projects have been devised in the United States and Australia.
Figure 5 Government support systems for hydrogen worldwide
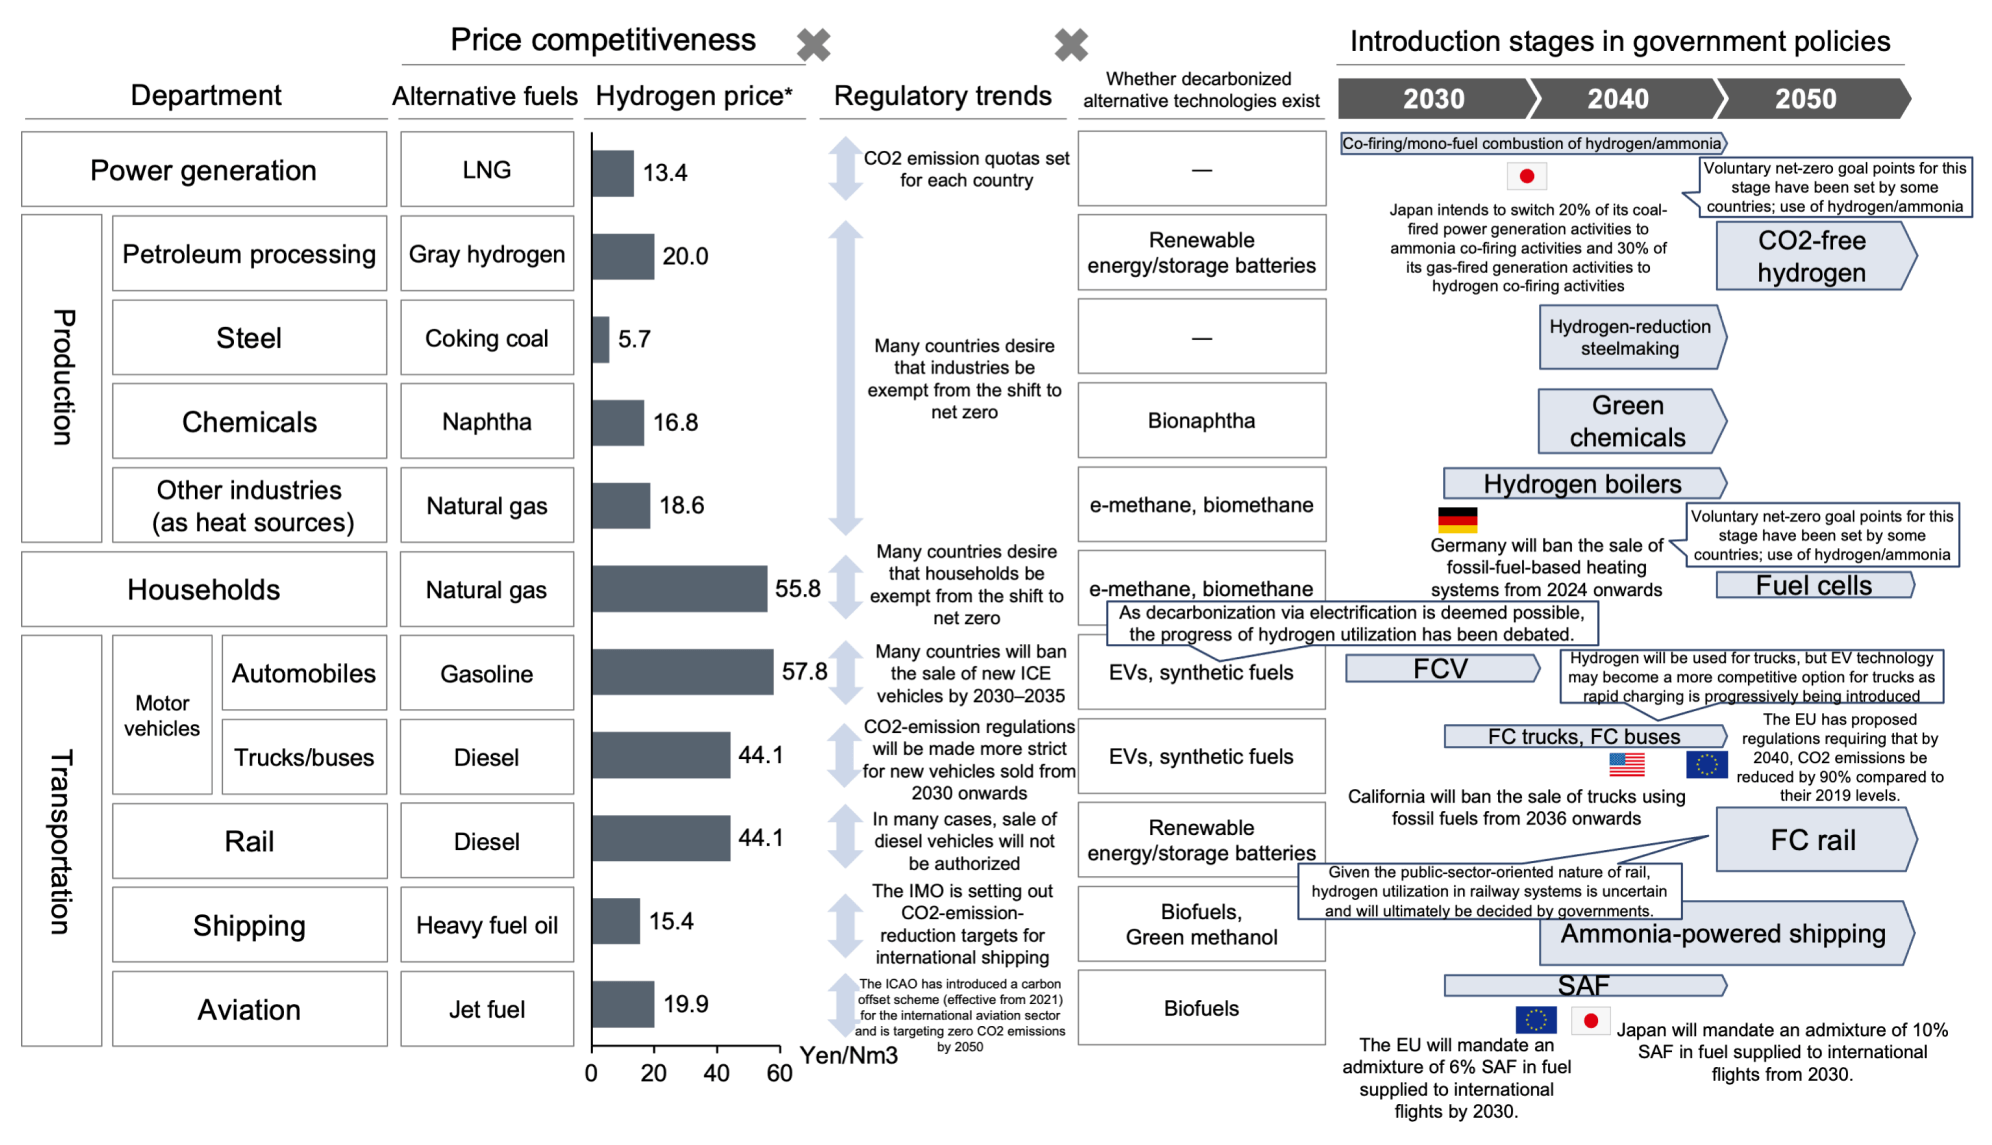
The timing of hydrogen adoption by customers is determined by three factors: cost competitiveness, regulations, and the availability of alternative technologies. Customers compare hydrogen/ammonia with traditionally used fuels based on these factors (Figure 6). From a cost competitiveness perspective, hydrogen can effectively substitute gasoline and diesel, however, electric vehicles (EVs) might be more cost-competitive alternatives to hydrogen fuel cell vehicles. From a perspective of regulations, hydrogen demand emerges where targets have been established for hydrogen/ammonia usage in power generation and sustainable aviation fuels (SAF) and where replacement of a certain percentage of fossil-based fuel with SAF is now mandated by law. The progress of hydrogen introduction varies across countries. The EU and other countries are spearheading the replacement of current heat sources with hydrogen within the manufacturing process of carbon-intensive industries. Hydrogen might also be used in rail transportation depending on decisions made by governments, who are the effective owners in this sector.
Figure 6 Industries with a possibility of adopting hydrogen/ammonia
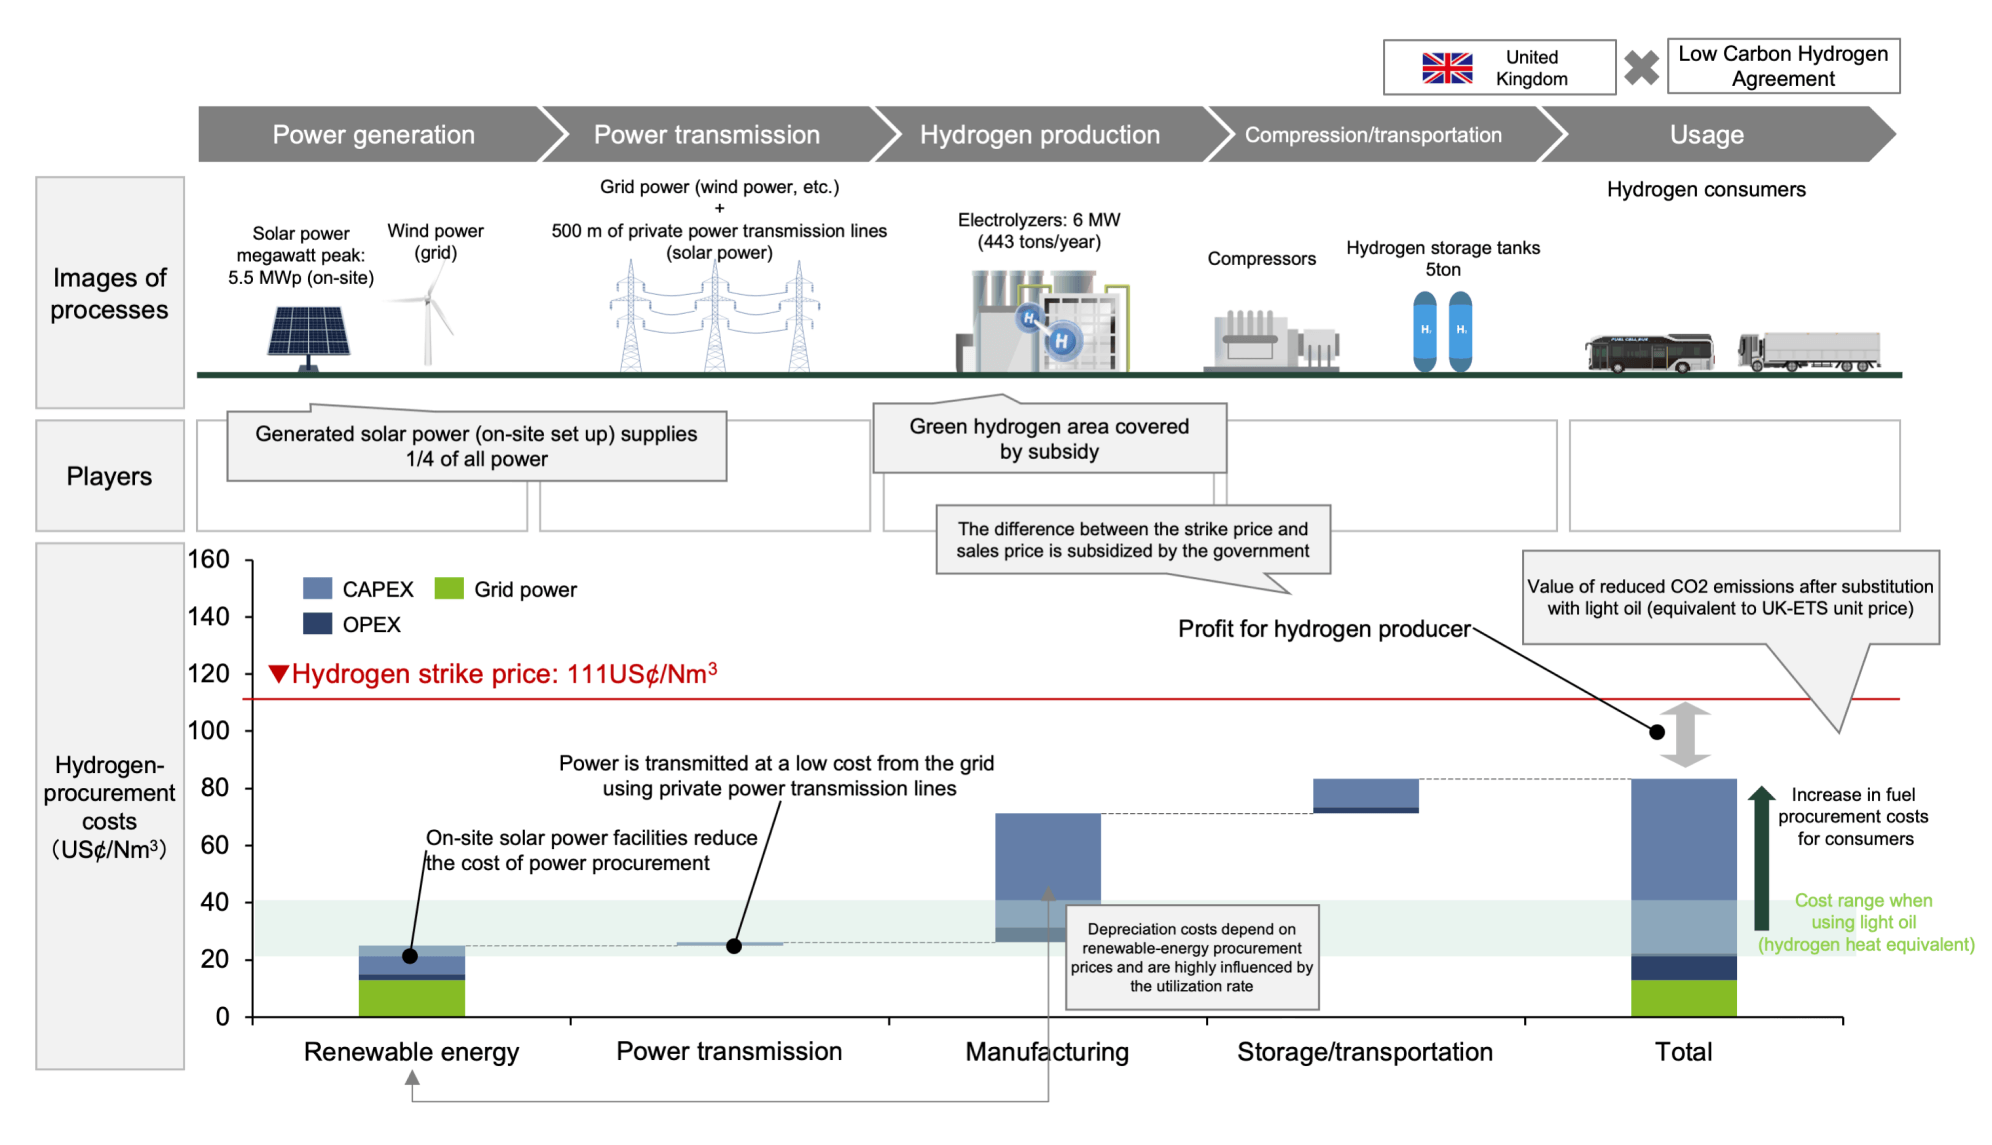
As hydrogen markets are unlikely to exhibit the same liquidity as those of crude-oil markets in the short term, the first wave of projects must form complete value chains from manufacturing to transportation and consumption. Thus business models that benefit all entities within such value chain must be established. As an example, Figure 7 shows a value chain for a hydrogen project in the UK. The weighted average price of successful bids (across 11 projects covering green-hydrogen production projects) was 111 US¢/Nm3. EPI estimates a delivery cost of around 80 US¢/Nm3 for these projects, suggesting a possible margin of about 30 US¢/Nm3. The cost model is detailed in the report, but this example highlights the importance of increasing hydrogen demand by carefully developing a project with a core hydrogen consumer and attracting surrounding consumers to maximize overall demand.
Figure 7 Demand-side model (results of the UK tender)
To ensure competitiveness of the hydrogen business
In the standard scenario of EPI’s model, the price of hydrogen will become competitive (i.e. its heat-equivalent price will cross that of natural gas) at different timepoints in different regions: by early 2030s in the EU, in ~2040 in the United States, and during mid-2040s in Japan. As hydrogen will not be immediately widely adopted without incentives, commercial development of hydrogen/ammonia will require technological developments that improve the efficiency of electrolysis, transportation, and usage. Meanwhile, costs must be minimized through utilization of subsidies. Therefore, growth strategies need to be fine-tuned to choose regions or counties wherein the right policies are emplaced.
Figure 8 Crossover point at which green hydrogen becomes cost-competitive with natural gas
The Hydrogen and Ammonia Industry Frontline Report 2024 developed by EPI offers useful information on the development of strategies. This edition of our report comprehensively overviews the hydrogen/ammonia market from technologies to business strategies. Specifically, it offers insights on the hydrogen/ammonia industry based on EPI’s unique models, presents cost analyses and cutting-edge case studies, and analyzes business models from the unique perspectives of EPI.
EPI offers strategy consulting services to clients seeking customized analyses tailored to their specific needs. We support clients’ businesses in the hydrogen/ammonia industry through our diverse portfolio of services, ranging from easy-to-purchase analysis reports to strategy consulting.
